
Download this report as a PDF file ![]()
Download the Appendix D Tables as a PDF file ![]()
Addendum
Assessment of Radiofrequency Microwave Radiation Emissions from
Silver Springs OWS-NIC514
Model Wireless Electric Meter
Sage Associates
Santa Barbara, CA
USA
February 18, 2011
TABLE OF CONTENTS
INTRODUCTION AND PURPOSE OF THIS ADDENDUM
SUMMARY OF FINDINGS
APPLICABLE PUBLIC SAFETY LIMITS
FCC Bulletin OET 65 Guidelines (Time-Averaging Limits)
ANSI/IEEE C95.1-1992, 1999 (Peak Power Limits)
METHODOLOGY
CONCLUSIONS
TABLES
Table 1 – Distance at which FCC Limit is Violated
Table 2 – Potential FCC Violations – Nursery at 11”
Table 3 – Potential FCC Violations – Kitchen at 28” (in inches)
Table 4 – Inhibition of DNA Repair in Human Stem Cells (at 11”)
Table 5 – Inhibition of DNA Repair in Human Stem Cells (at 28”)
Table 6 – Leakage of Blood-brain Barrier (at 11”)
Table 7 – Leakage of Blood-brain Barrier (at 28”)
Table 8 – Adverse Neurological Symptoms (at 11”)
Table 9 – Adverse Neurological Symptoms (at 28”)
REFERENCES
APPENDIX D
INTRODUCTION AND PURPOSE OF THIS ADDENDUM
This Report Addendum has been prepared to document radiofrequency radiation (RF) levels associated with the Silver Springs/PG&E wireless smart meter model OWS-NIC514 that is being installed in northern California and other service areas within PG&E territory.
Following completion of the original Smart Meter RF Assessment which used the Itron SKAMI-4 meter as the ‘type’ meter, it came to the attention of the authors that PG&E’s OWS-NIC514 model might have higher RF emissions. This would likely result in greater numbers of conditions where FCC violations of the public safety limit could occur; and greater space within private residences and properties that might be chronically exposed to excessively high RF levels, some of which could reach levels reported to cause adverse health effects.
The previous report (also downloadable from this webpage) provided predicted RF levels from the ITRON SKAMI-4 model in use by Southern California Edison and possibly other utilities.
As with the original Report, computer modeling shows of the range of possible smart meter RF levels that are occurring in the typical installation and operation of a single smart meter, and also multiple meters in one location. Four reflection factors and ten duty cycles are modeled for each scenario (one meter or multiple meters). Collector meters are not assessed in this addendum.
SUMMARY OF FINDINGS
The RF emissions from the Silver Springs/PG&E OWS-NIC514 smart meter are 4.87 times (or 487% higher) than the Itron SKAMI-4 meter. This ratio holds constant for any of the modeling scenarios previously assessed.
Potential violations of current FCC public safety standards for smart meters in the manner installed and operated in California are predicted in this Report, based on computer modeling (Data Tables D1 – D24).
Violations of FCC safety limits for uncontrolled public access are identified at distances out to a distance of more than one foot for a single meter, and several feet for multiple meters, even under the most restrictive FCC formula using only a 60% reflection factor.
This means that there is significantly more space within the area around the wireless meter that may either violate FCC public safety limits, or create excessively elevated RF levels in occupied space that is potentially exposing occupants to chronically elevated RF exposures.
See CONCLUSIONS Section for complete information.
PUBLIC SAFETY LIMITS FOR RADIOFREQUENCY RADIATION
The FCC adopted limits for Maximum Permissible Exposure (MPE) are generally based on recommended exposure guidelines published by the National Council on Radiation Protection and Measurements (NCRP) in “Biological Effects and Exposure Criteria for Radiofrequency Electromagnetic Fields,” (NCRP, 1986). In the United States, the Federal Communications Commission (FCC) enforces limits for both occupational exposures (in the workplace) and for public exposures. The allowable limits are variable, according to the frequency transmitted. Only public safety limits for uncontrolled public access are assessed in this report.
Maximum permissible exposures (MPE) to radiofrequency electromagnetic fields are usually expressed in terms of the plane wave equivalent power density expressed in units of milliwatts per square centimeter (mW/cm2) or alternatively, absorption of RF energy is a function of frequency (as well as body size and other factors). The limits vary with frequency. Standards are more restrictive for frequencies at and below 300 MHz. Higher intensity RF exposures are allowed for frequencies between 300 MHz and 6000 MHz than for those below 300 MHz. In the frequency range from 100 MHz to 1500 MHz, exposure limits for field strength and power density are also generally based on the MPE limits found in Section 4.1 of “IEEE Standard for Safety Levels with Respect to Human Exposure to Radio Frequency Electromagnetic Fields, 3 kHz to 300 GHz,” ANSI/IEEE C95.1-1992 ( IEEE, 1992, and approved for use as an American National Standard by the American National Standards Institute (ANSI).
US Federal Communications Commission (FCC) Exposure Standards
Table 1, Appendix A FCC LIMITS FOR MAXIMUM PERMISSIBLE EXPOSURE (MPE)
(A) Limits for Occupational/Controlled Exposure
| Frequency | Electric Field | Magnetic Field | Power Density | Averaging |
|---|---|---|---|---|
| Range (MHz) | Strength (E) | Strength (H) | (S) | Time [E]2 [H]2 |
| (V/m) | (A/m) | (mW/cm2) | or S (minutes) | |
| 0.3-3.0 | 614 | 1.63 | (100)* | 6 |
| 3.0-30 | 1842/f | 4.89/f | (900/f2)* | 6 |
| 30-300 | 61.4 | 0.163 | 1.0 | 6 |
| 300-1500 | f/300 | 6 | ||
| 1500-100,000 | 5 | 6 |
B) FCC Limits for General Population/Uncontrolled Exposure
| Frequency | Electric Field | Magnetic Field | Power Density | Averaging |
|---|---|---|---|---|
| Range (MHz) | Strength (E) | Strength (H) | (S) | Time [E]2 [H]2 |
| (V/m) | (A/m) | (mW/cm2) | or S (minutes) | |
| 0.3-3.0 | 614 | 1.63 | (100)* | 30 |
| 3.0-30 | 824/f | 2.19/f | (180/f2)* | 30 |
| 30-300 | 27.5 | 0.073 | 0.2 | 30 |
| 300-1500 | — | — | f/1500 | 30 |
| 1500-100000 | — | — | 1.0 | 30 |
________________________________________________________________________
f = frequency in MHz *Plane-wave equivalent power density
NOTE 1: Occupational/controlled limits apply in situations in which persons are exposed as a consequence of their employment provided those persons are fully aware of the potential for exposure and can exercise control over their exposure. Limits for occupational/controlled exposure also apply in situations when an individual is transient through a location where occupational/controlled limits apply provided he or she is made aware of the potential for exposure.
NOTE 2: General population/uncontrolled exposures apply in situations in which the general public may be exposed, or in which persons that are exposed as a consequence of their employment may not be fully aware of the potential for exposure or can not exercise control over their exposure. Source: FCC Bulletin OET 65 Guidelines, page 67 OET, 19
METHODOLOGY
Radiofrequency fields associated with SMART Meters were calculated following the methodology described here. Prediction methods specified in Federal Communications Commission, Office of Engineering and Technology Bulletin 65 Edition 97-01, August 1997 were used in the calculations.1
FCC equations 6 and 10 require use of a 100% duty cycle (how much time the meter is transmitting RF signals), since the public cannot be excluded from areas around the meter. The report, however, calculates RF levels from 1% duty cycle to 100% duty cycle, for informational purposes, and because there is still much uncertainty and debate about how frequently the meters will be emitting RF signals. In this meter, both the 915 MHz antenna and the 2400 MHz antenna can transmit at the same time.
Section 2 of FCC OET 65 provides methods to determine whether a given facility would be in compliance with guidelines for human exposure to RF radiation. We used equation (3)
S = P x G x  = EIRP x = 1.64 x ERP x
4 x x R2 4 x x R2 4 x x R2
where:
S = power density (in µW/cm2)
P = power input to the antenna (in W)
G = power gain of the antenna in the direction of interest relative to an isotropic radiator
= duty cycle of the transmitter (percentage of time that the transmitter actually transmits over time)
R = distance to the center of radiation of the antenna
EIRP = PG
ERP = 1.64 EIRP
where:
EIRP = is equivalent (or effective) isotropically radiated power referenced to an isotropic radiator
ERP = is equivalent (or effective) radiated power referenced to a half-wave dipole radiator
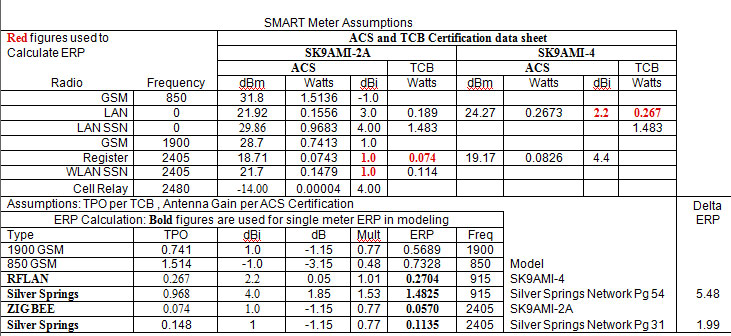
ERP (Effective Radiated Power) used in the computer modeling here is calculated using the TPO and antenna gain established for each model. The figures in red are used in this analysis (from Silver Springs FCC data).
Reflection Factor
This equation is modified with the inclusion of a ground reflection factor as recommended by the FCC. The ground reflection factor accounts for possible ground reflections that could enhance the resultant power density. A 60% (0.6) enhancement would result in a 1.6 (1 + 0.6) increase of the field strength or a 2.56 = (1.6)2 increase in the power density. Similar increases for larger enhancements of the field strength are calculated by the square of the original field plus the enhancement percentage. 2.3.4
| Reflection Factors:
60% = (1 + 0.6)2 = 2.56 times 100% = (1 + 1)2 = 4 times 1000% = (1 + 10)2 = 121 times 2000% = (1 + 20)2 = 441 times |
Duty Cycle
How frequently SMART Meters can and will emit RF signals from each of the antennas within the meters is uncertain, and subject to wide variations in estimation. For this reason, and because FCC OET 65 mandates a 100% duty cycle (continuous exposure where the public cannot be excluded) the report gives RF predictions for all cases from 1% to 100% duty cycle at 10% intervals. The reader can see the variation in RF emissions predicted at various distances from the meter (or bank of meters) using this report at all duty cycles. Thus, for purposes of this report, duty cycles have been estimated from infrequent to continuous.
Duty cycles for SMART Meters were calculated at:
Duty cycle :
1% 50%
5% 60%
10% 70%
20% 80%
30% 90%
40% 100%
Continuous Exposure
FCC Bulletin OET 65 and the ANSI/IEEE C95.1-1992, 1999 requires that continuous exposure be calculated for situations where there is uncontrolled public access. Continuous exposure in this case means reading the tables at 100% duty cycle.
“Another feature of the exposure guidelines is that exposures, in terms of power density, E2 or H2, may be averaged over certain periods of time with the average not to exceed the limit for continuous exposure.11
“As shown in Table 1 of Appendix A, the averaging time for occupational/controlled exposures is 6 minutes, while the averaging time for general population/uncontrolled exposures is 30 minutes. It is important to note that for general population/uncontrolled exposures it is often not possible to control exposures to the extent that averaging times can be applied. In those situations, it is often necessary to assume continuous exposure.” (FCC OET 65, Page 15)
Calculation Distances in Tables (3-inch increments)
Calculations were performed in 3-inch (.25 foot) increments from the antenna center of radiation. Calculations have been taken out to a distance of 96 feet from the antenna center for radiation for each of the conditions above. The antenna used for the various links in a SMART Meter is assumed to be at the center of the SMART Meter from front to back – approximately 3 inches from the outer surface of the meter.
Calculations have also been made for a typical nursery and kitchen. In the nursery it has been assumed that the baby in his or her crib that is located next to the wall where the electric SMART Meters are mounted. The closest part of the baby’s body can be as close as 11 inches* from the meter antenna. In the kitchen it has been assumed that a person is standing at the counter along the wall where the electric SMART Meters are mounted. In that case the closest part of the adult’s body can be located as close to the meter antenna as 28 inches.
CONCLUSIONS
FCC compliance violations for the OWS-NIC514 meter made by Silver Springs are likely to occur under widespread conditions of installation and operation of smart meters and collector meters in California. Violations of FCC safety limits for uncontrolled public access are identified at distances about one foot for a single meter, and several feet for multiple meters.
The RF emissions from the Silver Springs/PG&E OWS-NIC514 smart meter are 4.87 times (or 487% higher) than the Itron SKAMI-4 meter. This ratio holds constant for any of the modeling scenarios previously assessed.
Potential violations of current FCC public safety standards for smart meters in the manner installed and operated in California are predicted in this Report, based on computer modeling (Data Tables D1 – D24).
Violations of FCC safety limits for uncontrolled public access are identified at distances out to a distance of more than one foot for a single meter, and several feet for multiple meters, even under the most restrictive FCC formula using only a 60% reflection factor.
This means that there is significantly more space within the area around the wireless meter that may either violate FCC public safety limits, or create excessively elevated RF levels in occupied space that is potentially exposing occupants to chronically elevated RF exposures.
Table 1 shows how far away the meter(s) may violate the FCC thermal public safety limit of 655 uW/cm2. Even using the most conservative FCC equation with a 60% reflection factor, the meter exceeds the FCC limit outside the meter itself at 40% duty cycle, and all higher duty cycles to 100%. Using the FCC’s reflection factor of 100%, the FCC limit is exceeded at all duty cycles from 30% to 100%. The emissions from one meter are strong enough that the public is put at risk from exposures outward from the meter from approximately one foot to over six feet, depending on the reflection factor. For multiple meters at the same location, the zone of impact where FCC limit may be violated is somewhere between three feet and 19 feet, depending on the reflection factor.
Table 2 shows predicted RF levels and potential FCC violations of the public safety limit in a simulated nursery or bedroom, where the sleeping area is against a wall with a wireless meter flush-mounted on the outside wall at 11” distance from occupied space. Violations are predicted to occur in all scenarios modeled, with higher RF exposures predicted with higher reflection factors and higher duty cycles. The lowest RF level calculated under any of the conditions is 6.8 uW/cm2 at 11”, which is an excessively high RF level for chronic exposure. Most of the predictions fall in the range of several hundred microwatts per centimeter squared at 11” distance from the single meter. For multiple meters, the lowest predicted figure is 23.4 uW/cm2. Nearly all conditions modeled show that FCC violations may occur, regardless of how conservative the reflection factors and duty cycles are. For multiple meters at the same location, RF levels range from 23 to over 2000 uW/cm2 depending on duty cycle (at 60% reflection). RF levels range from 37 to over 3600 uW/cm2 depending on duty cycle (at 100% reflection).
Table 3 shows predicted RF levels and potential FCC violations of the public safety limit in a simulated kitchen, where the counter workspace is against a wall with a wireless meter flush-mounted on the outside wall at 28” distance from occupied space. There are no FCC violations predicted at 28” for the two lower reflection factors (60% and 100%), however, there are numerous predicted violations at the higher reflection factors (1000% and 2000%). For one meter, at 28”, the RF levels range from 1.1 to 105 uW/cm2 at 60% reflection; and 1.6 to 165 uW/cm2 at 100% reflection.. For multiple meters, the comparable ranges are 2.7 to 268 uW/cm2 at 60% reflection, and 4.2 to 418 uW/cm2 at 100% reflection (the two lowest factors).
The absolute RF levels are significantly higher that those reported in many scientific studies to be associated with adverse health effects.
Tables 4 and 5 compare RF levels in the nursery simulation (at 11”) and the kitchen simulation (at 28”) to RF levels reported to impair DNA repair in human stem cells. Tables 4 and 5 allow a comparison of predicted RF levels from the OWS-NIC514 meter against a scientific benchmark for harm of 92 uW/cm2 that is reported to impair the ability of human stem cells to repair damage to DNA.
Nearly every scenario modeled predicts RF levels from either one smart meter or multiple smart meters to be in excess of that shown to reduce DNA repair in human stem cells.
Of 96 cases modeled at 11” (nursery crib example), only seven are below the 92 uW/cm2 benchmark for harm.
Of 96 cases modeled at 28” (kitchen workspace example) only 27 are below the 92 uW/cm2 benchmark for harm.
Tables 6 and 7 compare RF levels in the nursery simulation (at 11”) and the kitchen simulation (at 28”) to RF levels reported to cause pathological leakage of the blood-brain barrier. Such leakage is associated with neuron death (death of brain cells).
Every scenario modeled predicts RF levels from either one smart meter or multiple smart meters to be in excess of associated with pathological leakage of the blood-brain barrier. Regardless of duty cycle or reflection factor, ALL cases modeled showed that for a single meter or multiple meters, RF levels exceed that associated with damage to the blood-brain barrier.
Of 96 cases modeled at 11” (nursery crib example), ALL produce RF levels in excess of the 0.4-8 uW/cm2 benchmark for harm to the blood-brain barrier.
Of 96 cases modeled at 28” (kitchen workspace example, ALL produce RF levels in excess of the 0.4 – 8 uW/cm2 benchmark for harm to the blood-brain barrier.
Table 8 and 9 compare RF levels in the nursery and kitchen simulations to RF levels reported to cause adverse neurological symptoms (headache, sleep disruption, restlessness, tremor, cognitive impairment, tinnitus), increased cancer risk or heart problems (arrhythmias, altered heart rhythm, palpitations).
Of 96 cases modeled at 11” (nursery crib example) ALL produce RF levels in excess of the 0.1uW/cm2 benchmark for neurological effects, cardiac problems and increased cancer risk.
Of 96 cases modeled at 28” (kitchen workspace example) ALL produce RF levels in excess of the 0.1uW/cm2 benchmark for neurological effects, cardiac problems and increased cancer risk.
FCC compliance violations for the OWS-NIC514 meter made by Silver Springs are likely to occur under widespread conditions of installation and operation of smart meters and collector meters in California. Violations of FCC safety limits for uncontrolled public access are identified at distances about one foot for a single meter, and several feet for multiple meters.
Consumers may also have already increased their exposures to radiofrequency radiation in the home through the voluntary use of wireless devices (cell and cordless phones), PDAs like BlackBerry and iPhones, wireless routers for wireless internet access, wireless home security systems, wireless baby surveillance (baby monitors), and other emerging wireless applications. Neither the FCC, the CPUC, the utility nor the consumer know what portion of the allowable public safety limit is already being used up or pre-empted by RF from other sources already present in the particular location a smart meter may be installed and operated.
Consumers, for whatever personal reason, choice or necessity who have already eliminated all possible wireless exposures from their property and lives, may now face excessively high RF exposures in their homes from smart meters on a 24-hour basis. This may force limitations on use of their otherwise occupied space, depending on how the meter is located, building materials in the structure, and how it is furnished.
People who are afforded special protection under the federal Americans with Disabilities Act are not sufficiently acknowledged nor protected. People who have medical and/or metal implants or other conditions rendering them vulnerable to health risks at lower levels than FCC RF limits may be particularly at risk (Tables 30-31). This is also likely to hold true for other subgroups, like children and people who are ill or taking medications, or are elderly, for they have different reactions to pulsed RF. Childrens’ tissues absorb RF differently and can absorb more RF than adults (Christ et al, 2010; Wiart et al, 2008). The elderly and those on some medications respond more acutely to some RF exposures.
Safety standards for peak exposure limits to radiofrequency have not been developed to take into account the particular sensitivity of the eyes, testes and other ball shaped organs. There are no peak power limits defined for the eyes and testes, and it is not unreasonable to imagine situations where either of these organs comes into close contact with smart meters and/or collector meters, particularly where they are installed in multiples (on walls of multi-family dwellings that are accessible as common areas).
In summary, no positive assertion of safety can be made by the FCC, nor relied upon by the CPUC, with respect to pulsed RF when exposures are chronic and occur in the general population. Indiscriminate exposure to environmentally ubiquitous pulsed RF from the rollout of millions of new RF sources (smart meters) will mean far greater general population exposures, and potential health consequences. Uncertainties about the existing RF environment (how much RF exposure already exists), what kind of interior reflective environments exist (reflection factor), how interior space is utilized near walls), and other characteristics of residents (age, medical condition, medical implants, relative health, reliance on critical care equipment that may be subject to electronic interference, etc) and unrestrained access to areas of property where meter is located all argue for caution.


REFERENCES
ANSI/IEEE standards adopted in 1992 (C95.1-1992) and 1999 revisions
June 2001 SC-4 Committee Minutes
BioInitiative Working Group, Cindy Sage and David O. Carpenter, Editors. BioInitiative Report: A Rationale for a Biologically-based Public Exposure Standard for Electromagnetic Fields (ELF and RF) at www.bioinitiative.org, August 31, 2007.
Christ A Gosselin MC Christopoulou M Kühn S Kuster N. Age dependent tissue-specific exposure of cell phone users. Physics in Medicine and Biology, Volume 55, Issue 7, pp. 1767–1783, 7 April 2010, online March 5
EPRI, 2010. A Perspective on Radio-Frequency Exposure Associated With Residential Automatic Meter Reading Technology, Electric Power Research Institute, Palo Alto, CA.
Federal Communications Commission, 1997. FCC Bulletin OET 65 97-01 Guidelines Evaluating Compliance with FCC Guidelines for Human Exposure to Radiofrequency Electromagnetic Fields.
Hondou T Ueda T Sakat Y Tanigwa N Suzuki T Kobayashi T Ikeda K.
Passive Exposure to Mobile Phones: Enhancement of Intensity by Reflection, Journal of the Physical Society of Japan Vol. 75, No. 8, August, 2006, 084801 (2006) The Physical Society of Japan
Hondou T, Rising Level of Public Exposure to Mobile Phones:Accumulation through Additivity and Reflectivity. Journal of the Physical Society of Japan, Vol. 71, No. 2, February, 2002, pp. 432–435 (2002) The Physical Society of Japan.
The Institute of Electrical and Electronic Engineers, Inc. 1999. IEEE Standards Coordinating Committee 28, IEEE Standard for Safety Levels with Respect to Human Exposure to Radio Frequency Electromagnetic Fields 3 kHz to 300 GHz. December, 1998.
Khurana VG Hardell L Everaert J Bortkiewicz A Carlberg M Ahonen M, 2010. Epidemiological Evidence for a Health Risk from Mobile Phone Base Stations. Int Journal of Occupational Environmental Health 2010;16:263–267
Kundi M Hutter HP Mobile phone base stations—Effects on wellbeing and health. Pathophysiology 16 (2009) 123–135
Markova E Malmgren LOG Belyaev IY. Microwaves from mobile phones inhibit 53PB1 focus formation in human stem cells stronger than in differentiated cells: Possible mechanistic link to cancer risk. Environmental Health Perspectives On-line 22 October 2009 doi:10.1289/ehp.0900781
National Council on Radiation Protection and Measurements (NCRP) in “Biological Effects and Exposure Criteria for Radiofrequency Electromagnetic Fields,” NCRP Report No. 86, Sections 17.4.1, 17.4.1.1, 17.4.2 and 17.4.3. Copyright NCRP, 1986, Bethesda, Maryland 20814
National Toxicology Program Fact Sheet, (2009). Cell Phone Radiofrequency Radiation Studies, (September 2009).
Vermeeren G Gosselin MC Gosselin Kuhn S Kellerman V Hadmen A Gati A Joseph W Wiart J Meyer F Kuster N Martens L. The influence of the reflective environment on the absorption of a human male exposed to representative base station antennas from 300 MHz to 5 GHz, Phys. Med. Biol. 55 (2010) 5541–5555 doi:10.1088/0031-9155/55/18/018
Wiart, J., Hadjem, A., Wong, M.F., & Bloch, I. (2008). Analysis of RF exposure in the head tissues of children and adults. Physical Medicine & Biology, 53, 3681-3695.
Appendix D Tables D1 –D24 – Download the Appendix D Tables as a PDF ![]()
Radiofrequency Radiation Versus Distance
One Smart Meter
Table D1 60% Reflection (1%-100% duty cycles in each table)
Table D2 100% Reflection (1%-100% duty cycles in each table)
Table D3 1000% Reflection* (1%-100% duty cycles in each table)
Table D4 2000% Reflection* (1%-100% duty cycles in each table)
Multiple Smart Meters (Four**)
Table D5 60% Reflection (1%-100% duty cycles in each table)
Table D6 100% Reflection (1%-100% duty cycles in each table)
Table D7 1000% Reflection (1%-100% duty cycles in each table) Table D8 2000% Reflection (1%-100% duty cycles in each table)
Nursery Tables (Crib at 11”)
One Smart Meter
Table D9 60% Reflection (1%-100% duty cycles in each table)
Table D10 100% Reflection (1%-100% duty cycles in each table)
Table D11 1000% Reflection (1%-100% duty cycles in each table)
Table D12 2000% Reflection (1%-100% duty cycles in each table)
Four Smart Meters
Table D13 60% Reflection (1%-100% duty cycles in each table)
Table D14 100% Reflection (1%-100% duty cycles in each table)
Table D15 1000% Reflection (1%-100% duty cycles in each table)
Table D16 2000% Reflection (1%-100% duty cycles in each table)
Kitchen Tables (Work Space at 28”)
One Smart Meter
Table D17 60% Reflection (1%-100% duty cycles in each table)
Table D18 100% Reflection (1%-100% duty cycles in each table)
Table D19 1000% Reflection (1%-100% duty cycles in each table)
Table D20 2000% Reflection (1%-100% duty cycles in each table)
Four Smart Meters
Table D21 60% Reflection (1%-100% duty cycles in each table)
Table D22 100% Reflection (1%-100% duty cycles in each table)
Table D23 1000% Reflection (1%-100% duty cycles in each table)
Table D24 2000% Reflection (1%-100% duty cycles in each table)